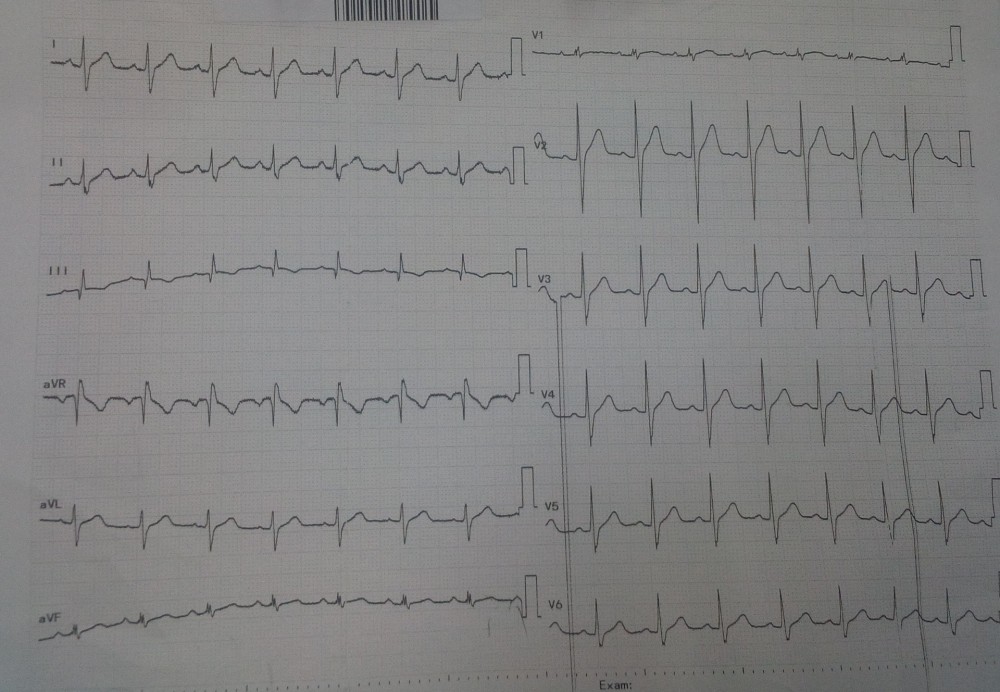
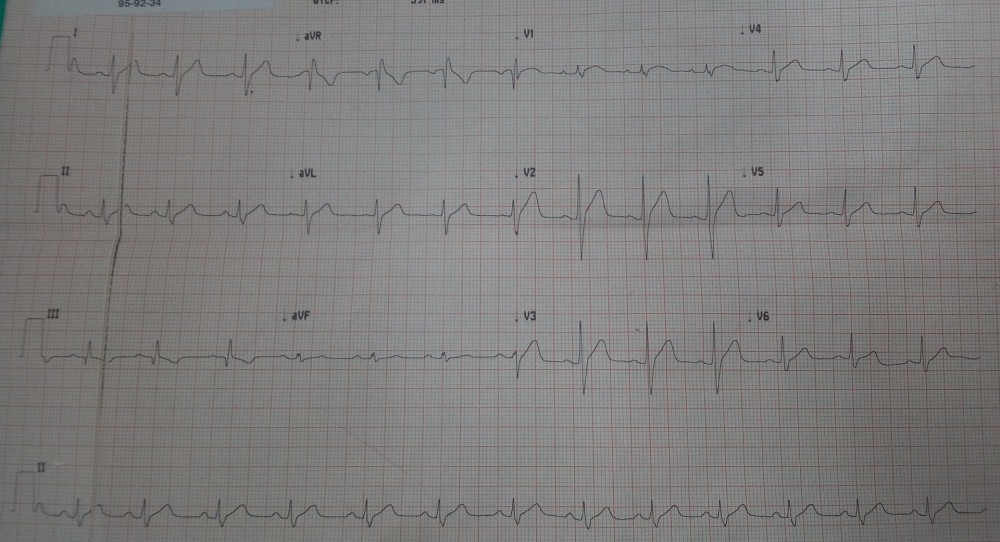
First ECG:


Thought 1: What is your diagnosis based on classic pattern found in this ECG?
Thought 2: Does his ECG suggest that he has had a "silent" inferior myocardial infarct?
Thought 3: What transient ECG abnormality you found in this case?
Explanation:
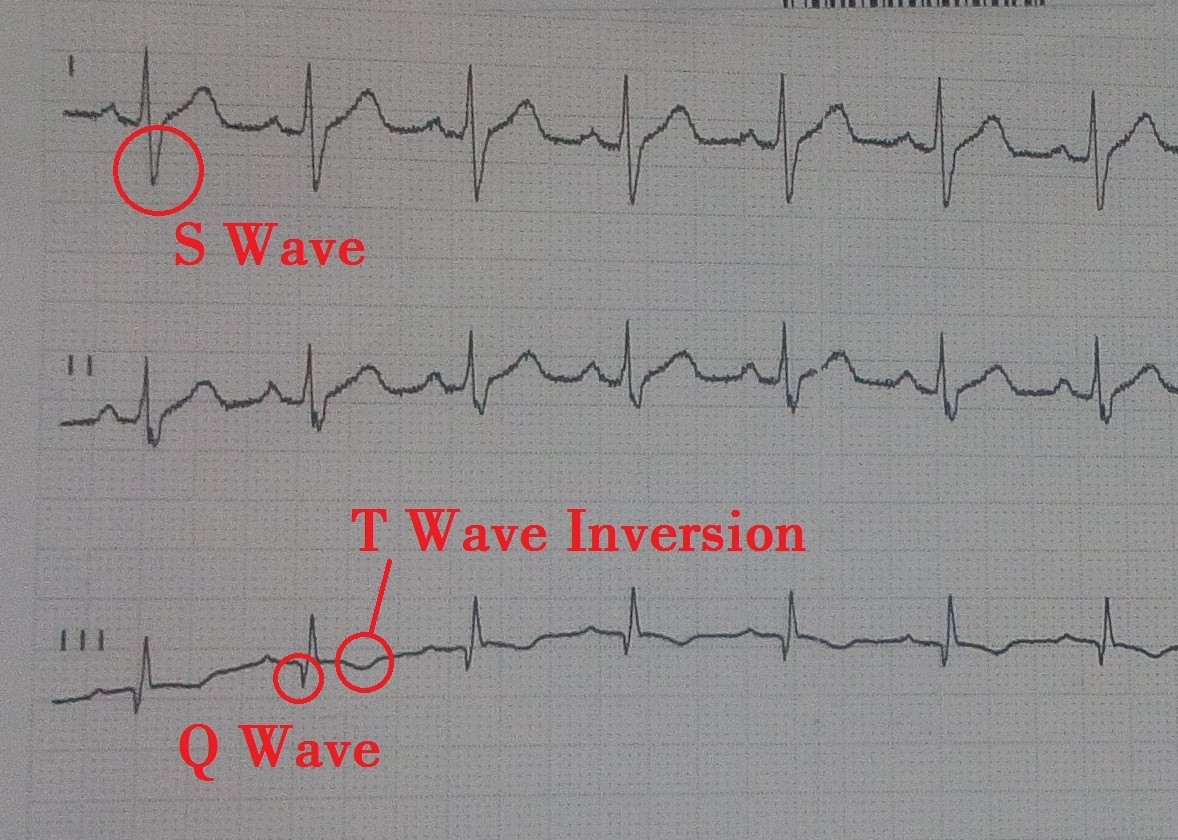
It's not every day you get to see a classic EKG finding for a very common medical condition. Most doctors have heard of S1Q3T3. That's the classic S1Q3T3 pattern that is:- Deep S wave in Lead I: ≥1.5 mm
- Q wave in Lead III: ≥1.5 mm
- T wave inversion in Lead III

Why Its not Myocardial infarction:
This isolated Q wave in lead III with a negative T wave is a common normal variant. Remember that lead III is "BIPOLAR", that is, it is the instantaneous difference in voltage recorded between the left leg and left arm. Therefore it has no special geographic significance in and of itself e.g.: it does not necessarily reflect the inferior wall of the heart.
Notice that when you record lead III, the positive pole of your galvanometer (or ECG recorder) is attached to the left leg and the negative pole is attached to the left arm. Therefore, lead III represents the instantaneous difference in voltage between these two points of the body.
III = aVF - aVL
The voltage recorded at aVL is being continuously subtracted from aVF.

Another way of representing lead III (remember your algebra?) is: III = aVF + (-aVL)
Putting it visually:
Putting it visually:

So an initial R wave in aVL which is quite common will translate into a Q wave in lead III. This Q wave can be very prominent at times but should not be misinterpreted as due to an inferior infarct. The same is true of the negative T wave in lead III. Notice in this case that a normal positive T wave in aVL is responsible for a negative T wave in lead III.
Beware of lead III! For diagnosing an inferior infarct look first to lead aVF which DOES HAVE true spatial significance and after that to leads III and II to which aVF contributes, but only indirectly. Despite the Q wave and the negative T wave in lead III inferior MI is unlikely in this case and no further evaluation is needed for MI.
Beware of lead III! For diagnosing an inferior infarct look first to lead aVF which DOES HAVE true spatial significance and after that to leads III and II to which aVF contributes, but only indirectly. Despite the Q wave and the negative T wave in lead III inferior MI is unlikely in this case and no further evaluation is needed for MI.
ECG changes in Pulmonary Embolism:
The ECG changes associated with acute pulmonary embolism may be seen in any condition that causes acute pulmonary hypertension, including hypoxia causing pulmonary hypoxic vasoconstriction.
Key ECG findings include:
- Sinus tachycardia – the most common abnormality; seen in 44% of patients.
- Complete or incomplete RBBB – associated with increased mortality; seen in 18% of patients.
- Right ventricular strain pattern – T wave inversions in the right precordial leads (V1-4) ± the inferior leads (II, III, aVF). This pattern is seen in up to 34% of patients and is associated with high pulmonary artery pressures.
- Right axis deviation – seen in 16% of patients. Extreme right axis deviation may occur, with axis between zero and -90 degrees, giving the appearance of left axis deviation (“pseudo left axis”).
- Dominant R wave in V1 – a manifestation of acute right ventricular dilatation.
- Right atrial enlargement (P pulmonale) – peaked P wave in lead II > 2.5 mm in height. Seen in 9% of patients.
- SI QIII TIII pattern – deep S wave in lead I, Q wave in III, inverted T wave in III. This “classic” finding is neither sensitive nor specific for pulmonary embolism; found in only 20% of patients with PE.
- Clockwise rotation – shift of the R/S transition point towards V6 with a persistent S wave in V6 (“pulmonary disease pattern”), implying rotation of the heart due to right ventricular dilatation.
- Atrial tachyarrhythmias – AF, flutter, atrial tachycardia. Seen in 8% of patients.
- Non-specific ST segment and T wave changes, including ST elevation and depression. Reported in up to 50% of patients with PE.
Compared to findings of Acute Coronary Syndrome:
While T wave inversions are commonly associated with acute coronary syndromes, there are several findings associated with pulmonary embolism that differentiate this diagnosis from ACS.
- ACS is rarely associated with tachycardia
- Both ACS and PE will present with elevated troponin
- Ultrasonography may be useful in differentiating the two
- Kosuge et al have shown that simultaneous inversion in III and V1 are diagnostically significant:
Differential Diagnosis of S1Q3T3 Pattern:
The ECG changes described above are not unique to PE. A similar spectrum of ECG changes may be seen with any cause of acute or chronic cor pulmonale (i.e. any disease that causes right ventricular strain / hypertrophy due to hypoxic pulmonary vasoconstriction).Acute cor pulmonale
- Severe pneumonia
- Exacerbation of COPD / asthma
- Pneumothorax
- Recent pneumonectomy
- Upper airway obstruction
Chronic cor pulmonale
- Chronic obstructive pulmonary disease
- Recurrent small PEs
- Cystic fibrosis
- Interstitial lung disease
- Severe kyphoscoliosis
- Obstructive sleep apnoea
References:
- Wagner, GS. Marriott’s Practical Electrocardiography (11th edition), Lippincott Williams & Wilkins 2007.
- Kosuge M, Kimura K, Ishikawa T, Ebina. Electrocardiographic differentiation between acute pulmonary embolism and acute coronary syndromes on the basis of negative T waves. Am J Cardiol. 2007 Mar 15;99(6):817-21. Epub 2007 Jan 30. PMID:17350373.
Comments
Post a Comment
Drop your thoughts here, we would love to hear from you